
作者|Sadrach Pierre, Ph.D.
编译|VK
来源|Towards Data Science
对于数据科学家来说,处理丢失的数据是数据清理和模型开发过程中的一个重要部分。通常情况下,真实数据包含多个稀疏字段或包含错误值的字段。在这篇文章中,我们将讨论如何建立可以用来填补数据中缺失或错误值的模型。
出于我们的目的,我们将使用可以在这里找到的葡萄酒数据集:https://www.kaggle.com/zynicide/wine-reviews
import pandas as pd
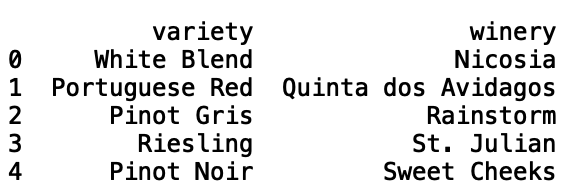
df = pd.read_csv("winemag-data-130k-v2.csv")接下来,让我们输出前五行数据:
print(df.head())
让我们从这些数据中随机抽取500条记录。这将有助于加快模型训练和测试,尽管读者可以很容易地对其进行修改:
import pandas as pd
df = pd.read_csv("winemag-data-130k-v2.csv").sample(n=500, random_state = 42)
现在,让我们打印与数据对应的信息,这将使我们了解哪些列缺少值:
print(df.info())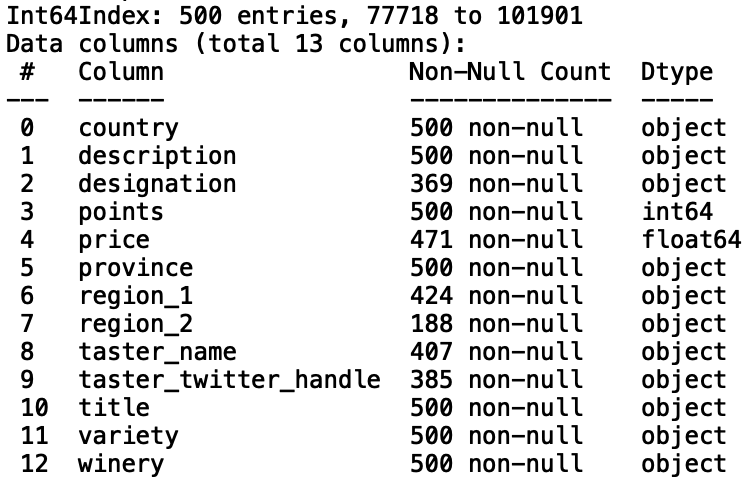
有几个列的非空值小于500,这与缺少的值相对应。首先,让我们考虑建立一个模型,用“points”来估算缺失的“price”值。首先,让我们打印“price”和“points”之间的相关性:
print("Correlation: ", df['points'].corr(df['price']))
我们看到了一个微弱的正相关。让我们建立一个线性回归模型,用“points”来预测“price”。首先,让我们从“scikit learn”导入“LinearRegresssion”模块:
from sklearn.linear_model import LinearRegression现在,让我们为训练和测试拆分数据。我们希望能够预测缺失值,但我们应该使用真实值“price”来验证我们的预测。让我们通过只选择正价格值来筛选缺少的值:
import numpy as np
df_filter = df[df['price'] > 0].copy()
我们还可以初始化用于存储预测和实际值的列表:
y_pred = []
y_true = []
我们将使用K-fold交叉验证来验证我们的模型。让我们从“scikit learn”导入“KFolds”模块。我们将使用10折来验证我们的模型:
from sklearn.model_selection import KFold
kf = KFold(n_splits=10, random_state = 42)
for train_index, test_index in kf.split(df_filter):
    df_test = df_filter.iloc[test_index]
    df_train = df_filter.iloc[train_index]
我们现在可以定义我们的输入和输出:
for train_index, test_index in kf.split(df_filter):
    ...
    X_train = np.array(df_train['points']).reshape(-1, 1)
    y_train = np.array(df_train['price']).reshape(-1, 1)
    X_test = np.array(df_test['points']).reshape(-1, 1)
    y_test = np.array(df_test['price']).reshape(-1, 1)
并拟合我们的线性回归模型:
for train_index, test_index in kf.split(df_filter):
    ...
    model = LinearRegression()
    model.fit(X_train, y_train)
现在让我们生成并存储我们的预测:
for train_index, test_index in kf.split(df_filter):
    ...
    y_pred.append(model.predict(X_test)[0])
    y_true.append(y_test[0])
现在让我们评估一下模型的性能。让我们用均方误差来评估模型的性能:
print("Mean Square Error: ", mean_squared_error(y_true, y_pred))
并不太好。我们可以通过训练平均价格加上一个标准差来改善这一点:
df_filter = df[df['price'] <= df['price'].mean() + df['price'].std() ].copy()
...
print("Mean Square Error: ", mean_squared_error(y_true, y_pred))
虽然这大大提高了性能,但其代价是无法准确估算葡萄酒的price。与使用单一特征的回归模型预测价格不同,我们可以使用树基模型,例如随机森林模型,它可以处理类别和数值变量。
让我们建立一个随机森林回归模型,使用“country”、“province”、“variety”、“winery”和“points”来预测葡萄酒的“price”。首先,让我们将分类变量转换为可由随机森林模型处理的分类代码:
df['country_cat'] = df['country'].astype('category')
df['country_cat'] = df['country_cat'].cat.codes

df['province_cat'] = df['province'].astype('category')
df['province_cat'] = df['province_cat'].cat.codes

df['winery_cat'] = df['winery'].astype('category')
df['winery_cat'] = df['winery_cat'].cat.codes

df['variety_cat'] = df['variety'].astype('category')
df['variety_cat'] = df['variety_cat'].cat.codes
让我们将随机样本大小增加到5000:
df = pd.read_csv("winemag-data-130k-v2.csv").sample(n=5000, random_state = 42)接下来,让我们从scikit learn导入随机森林回归器模块。我们还可以定义用于训练模型的特征列表:
from sklearn.ensemble import RandomForestRegressor
features = ['points', 'country_cat', 'province_cat', 'winery_cat', 'variety_cat']
让我们用一个随机森林来训练我们的模型,它有1000个估计量,最大深度为1000。然后,让我们生成预测并将其附加到新列表中:
for train_index, test_index in kf.split(df_filter):
    df_test = df_filter.iloc[test_index]
    df_train = df_filter.iloc[train_index]

    X_train = np.array(df_train[features])
    y_train = np.array(df_train['price'])
    X_test = np.array(df_test[features])
    y_test = np.array(df_test['price'])
    model = RandomForestRegressor(n_estimators = 1000, max_depth = 1000, random_state = 42)
    model.fit(X_train, y_train)

    y_pred_rf.append(model.predict(X_test)[0])
    y_true_rf.append(y_test[0])
最后,让我们评估随机森林和线性回归模型的均方误差:
print("Mean Square Error (Linear Regression): ", mean_squared_error(y_true, y_pred))
print("Mean Square Error (Random Forest): ", mean_squared_error(y_pred_rf, y_true_rf))
我们看到随机森林模型具有优越的性能。现在,让我们使用我们的模型预测缺失的价格值,并显示price预测:
df_missing = df[df['price'].isnull()].copy()

X_test_lr = np.array(df_missing['points']).reshape(-1, 1)
X_test_rf = np.array(df_missing[features])

X_train_lr = np.array(df_filter['points']).reshape(-1, 1)
y_train_lr = np.array(df_filter['price']).reshape(-1, 1)

X_train_rf = np.array(df_filter[features])
y_train_rf = np.array(df_filter['price'])

model_lr = LinearRegression()
model_lr.fit(X_train_lr, y_train_lr)
print("Linear regression predictions: ", model_lr.predict(X_test_lr)[0][0])

model_rf = RandomForestRegressor(n_estimators = 1000, max_depth = 1000, random_state = 42)
model_rf.fit(X_train_rf, y_train_rf)
print("Random forests regression predictions: ", model_rf.predict(X_test_rf)[0])
我就到此为止,但我鼓励你尝试一下特征选择和超参数调整,看看是否可以提高性能。此外,我鼓励你扩展此数据进行插补模型,以填补“region_1”和“designation”等分类字段中的缺失值。在这里,你可以构建一个基于树的分类模型,根据分类和数值特征来预测所列类别的缺失值。
结论
总而言之,在这篇文章中,我们讨论了如何建立机器学习模型,我们可以用来填补数据中的缺失值。首先,我们建立了一个线性回归模型,用以预测葡萄酒的价格。然后,我们建立了一个随机森林模型,用“points”和其他分类变量来预测葡萄酒价格。我们发现,随机森林模型显著优于基于线性回归的数据插补模型。本文中的代码可以在GitHub上找到。谢谢你的阅读!
Github链接:https://github.com/spierre91/medium_code/blob/master/machine_learning/predict_missing_data.py
原文链接:https://towardsdatascience.com/predicting-missing-values-with-python-41e581511117
欢迎关注磐创AI博客站:
http://panchuang.net/
sklearn机器学习中文官方文档:
http://sklearn123.com/
欢迎关注磐创博客资源汇总站:
http://docs.panchuang.net/
原创文章,作者:磐石,如若转载,请注明出处:https://panchuang.net/2020/10/19/%e4%bd%bf%e7%94%a8python%e9%a2%84%e6%b5%8b%e7%bc%ba%e5%a4%b1%e5%80%bc/
